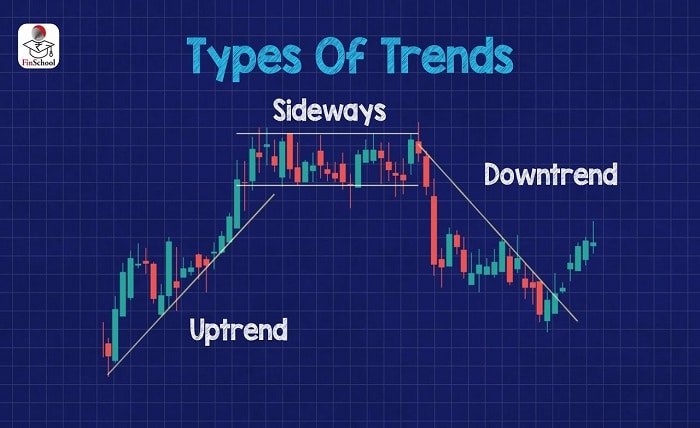
A trend line is a graphical representation used in data analysis to visualize patterns or trends within a dataset. By connecting key data points, trend lines help analysts and decision-makers interpret the direction of the data, whether it’s increasing, decreasing, or remaining constant over time. They are foundational tools in fields like finance, economics, marketing, and even scientific research.
The simplicity and utility of a trend line make it indispensable. Whether you are tracking stock market movements or analyzing sales growth, a trend line provides clarity in complex data scenarios.
The Importance of Trend Lines in Data Analysis
Trend lines play a crucial role in interpreting and predicting data trends. They help transform raw data into actionable insights, guiding business strategies and scientific explorations.
- Identify Patterns: Trend lines highlight patterns within datasets, helping to decipher whether variables are positively or negatively correlated.
- Forecast Future Trends: By extending a trend line, analysts can predict future data behavior, aiding strategic planning.
- Simplify Complex Data: Trend lines condense large datasets into understandable visual representations, making them accessible even to non-technical audiences.
For example, a business might use a trend line to observe seasonal sales trends and optimize inventory accordingly.
Types of Trend Lines and Their Applications
1. Linear Trend Line
A linear trend line represents data that shows a steady rate of increase or decrease. It is the simplest and most commonly used type.
Applications: Financial forecasts, revenue tracking, and time series analysis.
2. Exponential Trend Line
This trend line fits data that increases or decreases at an accelerating rate, often used for growth phenomena.
Applications: Population studies, viral growth analysis, and technological adoption.
3. Logarithmic Trend Line
Useful when data increases quickly and then levels off, this trend line is ideal for diminishing returns scenarios.
Applications: Market saturation studies and learning curve evaluations.
4. Polynomial Trend Line
When data fluctuates or has multiple peaks and troughs, a polynomial trend line captures these variations.
Applications: Weather patterns, sales spikes, or cyclical events.
5. Moving Average Trend Line
This smoothens data fluctuations to show a clear trend by averaging data points over a specific period.
Applications: Stock market analysis, economic indicators, and seasonal variations.
How to Draw a Trend Line?
Creating an accurate trend line involves careful analysis and visualization of data. Follow these steps:
- Collect Data: Gather and organize your data points.
- Select a Graph Type: Choose the most suitable graph, such as a scatter plot or a time series chart.
- Identify the Trend: Observe the overall direction of the data.
- Plot the Trend Line: Use software like Excel, Tableau, or Python libraries to plot a line that best fits your data.
- Validate the Trend Line: Ensure the trend line accurately represents the data by checking its correlation coefficient (R² value).
These steps ensure your trend line provides a meaningful representation of your dataset.
Common Pitfalls When Using Trend Lines
1. Overfitting or Underfitting
Selecting an overly complex trend line may lead to overfitting, where the line captures noise instead of actual trends. Conversely, underfitting oversimplifies the data, missing critical insights.
2. Ignoring Context
A trend line must be interpreted in context. For instance, an upward trend in sales during December might simply reflect seasonal patterns.
3. Misusing Data
Using insufficient or biased data can lead to inaccurate trend lines. Always ensure data quality before analysis.
Avoid these pitfalls to make the most of your trend lines and their interpretations.
Applications of Trend Lines in Different Industries
1. Finance
Trend lines are extensively used to analyze stock price movements, predict market trends, and manage investment portfolios.
2. Marketing
Marketers use trend lines to track customer behavior, measure campaign success, and forecast demand.
3. Healthcare
Trend lines help visualize patient data, track disease spread, and evaluate treatment efficacy.
4. Technology
In tech, trend lines identify user growth, app engagement, and adoption rates, guiding product development strategies.
5. Climate Science
Environmental researchers use trend lines to monitor climate change, temperature variations, and pollution levels.
Advanced Techniques for Analyzing Trend Lines
Beyond basic trend lines, advanced methods can provide deeper insights:
- Multiple Regression: Incorporates multiple variables to enhance trend line accuracy.
- Seasonal Adjustments: Accounts for recurring patterns to refine the trend line.
- Machine Learning Models: Leverages algorithms to identify and predict trends more effectively.
By integrating these techniques, trend line analysis becomes a powerful tool for complex datasets.
Conclusion
Trend lines are more than just simple lines on a graph—they are tools of immense analytical power. They help make sense of data, predict future patterns, and inform strategic decisions across various industries. Whether you are a business professional, researcher, or student, mastering trend lines can elevate your analytical capabilities and lead to better decision-making.
FAQs
1. What is the primary purpose of a trend line?
A trend line simplifies data visualization by highlighting patterns and forecasting future trends, aiding decision-making.
2. How do I choose the right type of trend line?
Choose based on your data’s nature: linear for steady trends, exponential for growth, logarithmic for leveling-off patterns, etc.
3. Can a trend line predict future outcomes accurately?
While trend lines provide predictions, their accuracy depends on data quality, context, and the validity of assumptions.
4. What software tools are best for creating trend lines?
Popular tools include Microsoft Excel, Tableau, Python (with libraries like Matplotlib and Seaborn), and R.
5. How do I ensure my trend line is reliable?
Validate your trend line using statistical metrics like the R² value and ensure the data quality is high.


